The water level in the stream is actually a useful parameter to show trends and set up warnings. It is nevertheless necessary to be able to convert the water level to the water flow (in m3/s). This will allow quantifying base flow and run off as part of the hydrological balance. This will be used mainly for evaluate the water available and evaluate flood risks. Actually, a statistical curve H-Q (Water Level versus Flow) must be established in each of the stations where the water level is measured.
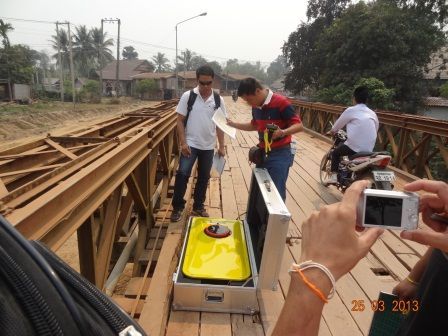
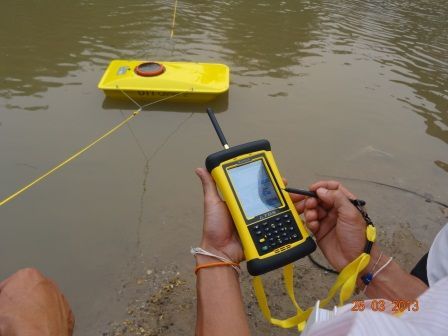
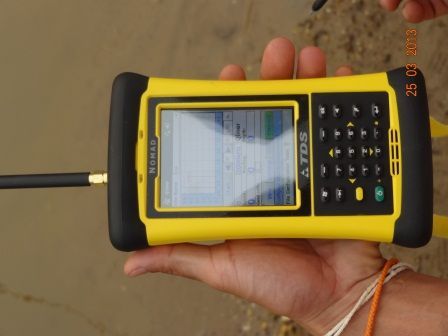
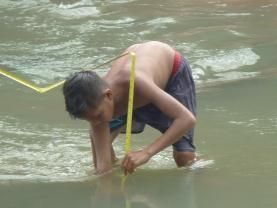
To proceed to this measurement, SUMALOM Nam Ton is now equipped with a Doppler Sensor, namely “Qliner” that allows automatic measurement of the stream cross-section and water velocity at different heights of the stream. The integration of the surface by the velocity gives us the flow for the water level observed at the time of the measurement. For very low flows, the traditional flow meter is used. For the time being, the Qliner faced technical problems that needed to be fixed in OTT, Germany. Only low flow could be measured.


User manual reference OTT-Qliner : http://www.ott.com/download/operating-instructions-mobile-river-discharge-measurement-system-ott-qliner-2-6/
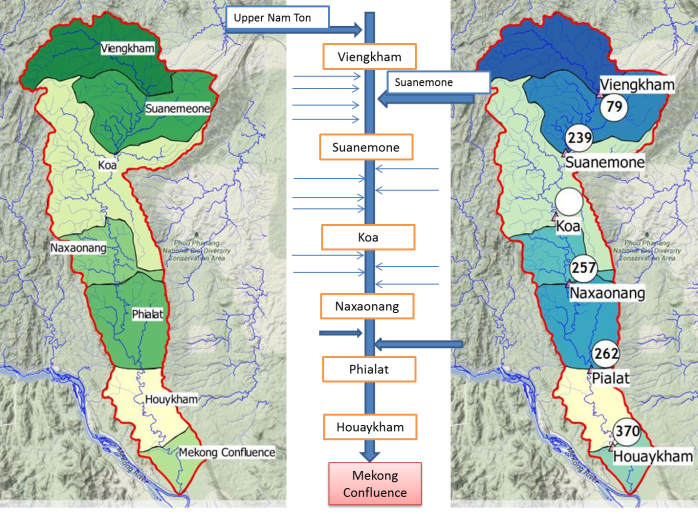
The minimum flow in Nam Ton watershed was measured twice. Once in January 2012 and once in April 2014. From the campaign January 2012, it shows that the Base Flow in the whole basin depends nearly only on what happened in the Upper Part of the Watershed. This leads to express 2 key Watershed Approach : (i) Water Conservation related activities should be focused in priority to the Upper Part of the Watershed; (ii) Investments and Development projects will generally be less impacting the water related natural resources if developed downstream rather than upstream.

The following figure is the result of the April 2014. Sub-watersheds have been drawn on a sketch and on the map in such a way that the outlet of the sub-watersheds corresponds to the staff gauges positions. This allows estimating the flow at the outlets of these watersheds which is one requirement for further calibration of models. On the same figure, the minimum flow as measured on 22 April 2014 is shown as well. Minimum flows are much lower than in January 2012 and shows a greater contribution from the drainage downstream (drainage can be tributaries, drainage from irrigated paddy fields or contribution from groundwater)